Core Web Vitals
Measuring Web App Performance.
This post was originally written for the AWH Insights Blog. You can read the original post there.
Web application performance is hard. You are developing applications for devices which you know nothing about. Users can be on desktop, mobile, tablets, or even game consoles. Each user on each device has unique performance characteristics, not to mention the headache that is network conditions. How do you ensure your application’s performance is good?
The first step is taking measurements. In order to improve, first you have to know what to improve. Performance metrics are complicated, though. When it comes to web applications, there’s lots of metrics (and acronyms) that get thrown around. TTFB, FCP, LCP, TTI, DOM Ready, and more. What metrics are important? Which ones correlate to what the user experiences?
Web Vitals
Web Vitals are an initiative by Google to create “unified guidance for quality signals that are essential to delivering a great user experience on the web”. Essentially, Web Vitals are a set of metrics chosen by Google engineers to give you a starting point for performance measurement. These metrics change over time as Google adapts them to changes in how users access and use the web, but the goal is to have a set of key metrics that can be used by anyone.
Core Web Vitals are a subset of Web Vitals. In particular, they are three metrics that are meant to provide site owners and operators with simple, measurable, and realistic performance numbers. These metrics are intended to represent performance as seen by the end user. The Core Web Vitals cover three aspects of page performance: loading, interactivity, and stability.
Additionally, Core Web Vitals are now a signal to Google Search, meaning these metrics can actually affect your site or application’s ranking in search results. Good performance has implications outside of happy users.
Loading
How fast a page loads is one of the largest contributors to performance, both actual and perceived. There are many ways to measure loading performance, but few can capture the entire picture in one number. Time to First Byte (TTFB) measures the delay between the request being made and the first response from the server. That’s a good measure of the server’s performance but is less helpful when client-side rendering is in the mix. Metrics like DOM Content Loaded don’t adequately correlate to when a user sees content. First Meaningful Paint is complex and still doesn’t fully represent when the page is fully loaded.
The solution is a pretty simple metric: Largest Contentful Paint or LCP. The LCP metric “…reports the render time of the largest image or text block visible within the viewport, relative to when the page first started loading.” To understand that, imagine a news article with a headline, image, and a bunch of text. The LCP time would be when the image has finished loading since it is likely the largest block visible “above the fold”.

A good LCP score is under 2.5 seconds from the initial page load. Anything over 4 seconds is bad and should prompt some changes to your application or page.
Slow LCP times are primarily caused by slow server response times, render blocking CSS or JavaScript, long load times on external resources like images, and client-side rendering. Solutions to these problems differ based on the actual issues at place, but optimizing the critical and above-the-fold render paths can help lower this score. For client-side rendering, pre-rending some content may be a good option, though that can certainly add some complexity.
Interactivity
The responsiveness of an application is another large contributor to perceived performance. Users expect responses to their actions to be fast, if not immediate. Measuring this kind of responsiveness is tricky, though.
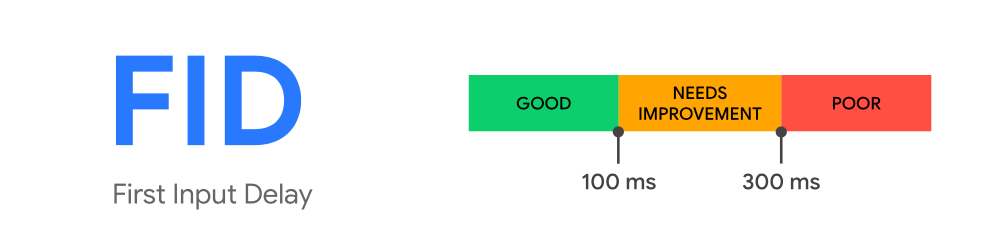
First Input Delay, or FID, is the metric used to measure the interactivity or responsiveness of the page. FID is the “…time from when a user first interacts with a page (i.e. when they click a link, tap on a button, or use a custom, JavaScript-powered control) to the time when the browser is actually able to begin processing event handlers in response to that interaction.” There are two important aspects to FID:
- It only measures the delay between the action and the start of handling that action.
- It is dependent on user interaction.
The first item there is important because FID is not a measure of how long the handling of the event takes. We’re only interested in the delay when the main thread is blocked while doing something else and cannot start processing that interaction. The second item listed above is also important because it means we cannot lab-test FID. We need real users to interact with our application to get FID values.
Due to FID requiring user interaction, we cannot measure it using scanning tools. For those tools, Total Blocking Time is a roughly equivalent metric, as it looks at the amount of time that the main thread was blocked during page load. In order to get real FID values, you will need to use a tool that can gather data from real users. We’ll dive into measurement tools at the end of this post.
Causes of slow FID usually stem from work being done on the main thread. Reducing this work can reduce the delay in processing interaction handlers. 3rd-party JavaScript can also cause problems and reducing the use of it can help improve FID.
Stability
One of the most frustrating experiences on the web is layout shift. You load up a page and are reading an article, but then an ad or something above where you are loads in and pushes the content down. Layout shift can range from mildly annoying to absolutely infuriating. It can also be damaging if buttons with critical or dangerous functionality are jumping around as the page loads.
Cumulative Layout Shift, or CLS, is the metric used to quantify layout shift. CLS is the measure “…of the largest burst of layout shift scores for every unexpected layout shift that occurs during the entire lifespan of a page”. There are two key takeaways from that definition. The first is that we are looking at bursts of layout shifts. Single elements appearing can be problematic, but it’s worse if there’s a constant stream of changes to the page. The second is that we are looking for unexpected layout shifts. If the user clicks a button and the page changes, that is not unexpected. If the user is doing nothing but reading and the page changes, that is a problem.
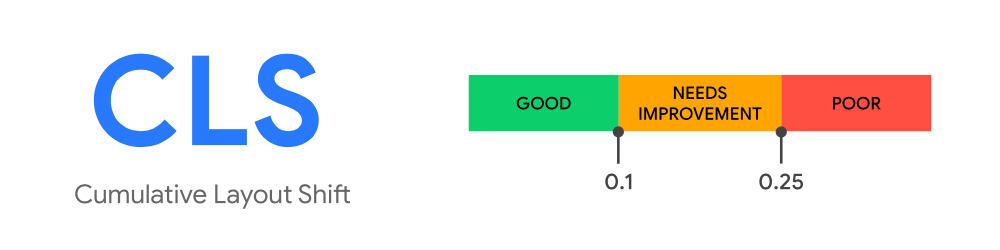
The actual scoring algorithm for CLS is complex and you can read more into the details here. A score of 0.1 or less is good and indicates little to no unexpected shifting. Anything over 0.25 will be disorienting to the user and should be fixed.
Common causes of layout shift include images (and other media) that lack size attributes. Without sizes defined in HTML, images cannot be allocated space on the page before the browser begins downloading the file. Adding these basic size attributes can easily fix many instances of layout shift.
Measuring Core Web Vitals
There are several ways to measure and track Core Web Vitals for your site.
- PageSpeed Insights is a tool by Google that can scan your site for performance issues and suggest fixes. It also uses data from the Chrome User Experience Report to give you real user data from the last 28 days.
- You can access the Core Web Vitals report for your site in the Google Search Console. You do need to verify your ownership of the site, but you can also get more historical data this way.
- The
web-vitalsJavaScript library can be used to record Core Web Vitals data directly from your site. It’s up to you how (or if) you record the data returned from the library, but it does give you real user data for every user of your site or application. - The Web Vitals Chrome extension can be used to view the Core Web Vitals of a page in real-time and is very useful for measuring while the application is under development.
- Scanning tools, like WebPageTest and Lighthouse, can be used to gather performance metrics. These tools can even be automated and run periodically. But they cannot measure FID due to the lab environment and thus can only report TBT, which does correlate strongly with FID but is not a full replacement.
Resources
- Web Vitals
- The business impact of Core Web Vitals
- Getting started with measuring Web Vitals
- Web Vitals Patterns
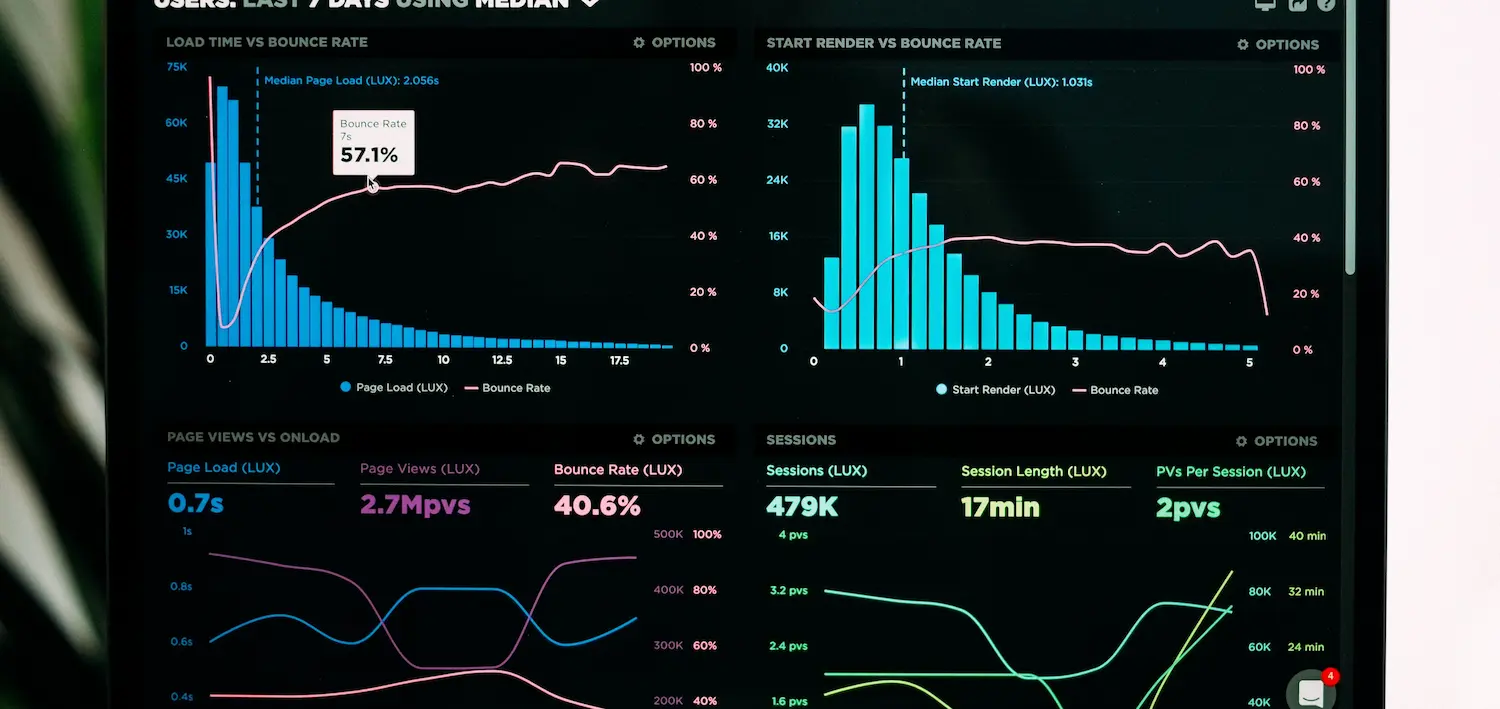
Photo by Luke Chesser on Unsplash.